What Is ROC Indicator – An Expert’s Take 2024
By Wilbert S
January 10, 2024 • Fact checked by Dumb Little Man
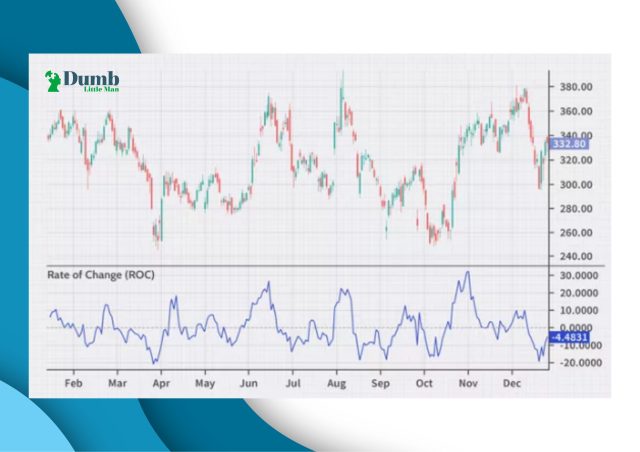
The ROC indicator falls among a list of many indicators which help investors and traders analyze price charts while looking for crucial information to anchor their decisions.
One key distinction with successful traders is building on excellent knowledge with a technical indicator to enrich abilities with their technical analysis. The purpose of this post will primarily focus on all the expert tips you require to use the ROC indicator excellently.
So, to ensure that we share the best and most actionable content here, we have taken an approach to blend theory with practice. Therefore, we’ve invited insightful expertise from Ezekiel Chew – the Co-founder and Lead trainer with Asia Forex Mentor.
Ezekiel Chew has more than two decades of successfully trading the financial markets. He shares his unique approach with trainee trades across free and paid courses.
Further down, readers will get to know what the ROC indicator is all about. There’s a key section on how traders should use the ROC indicator. Plus, there’s a critical section on how the ROC indicator is arrived at – in terms of calculations.
Towards picking the minds of traders’ and investors’ interaction with the ROC indicator, there’s a specific section sharing the trading rules you have to put on the table. And, of course, a clear scale to elaborate the indicators’ scores.
Part of the above also shares how you can adjust the periods or timeframes you target to analyze retrospectively.
Last is a concluding note, with a few FAQs to expect from the information we share regarding the ROC indicator.
What is the ROC Indicator?
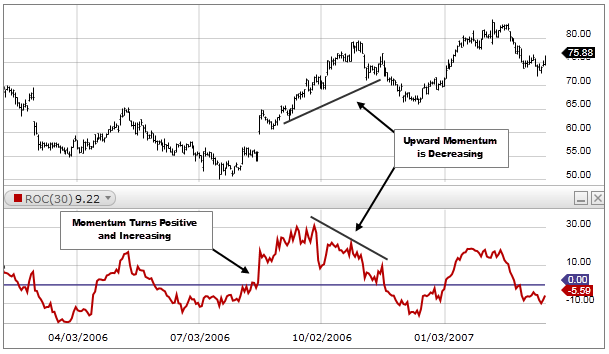
The ROC is the short form for the Rate of Change Indicator. And as the name suggests, ROC is a technical momentum indicator. It measures the rate percentage change with respect to a current price and a specific number of periods ago. You count backward from the most recent – closing price.
Some experts prefer referring to the ROC indicator as a non-banded oscillator. In simpler terms, ROC captures the rate of change in prices of assets of Forex currency pair for the number of periods you’ve set it to analyze backward.
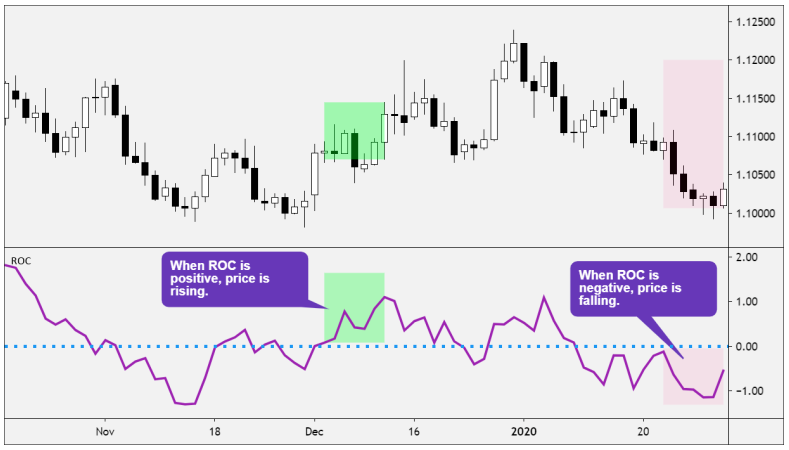
In terms of visual presentation, it’s easy to make interpretations of the ROC indicator. It’s presented in the form of a simple chart below the price charts. At the center of the graph is the line reading zero. So the actual reading falls either above the center line or below it.
Whenever the plot shown above the middle line 0, the prices make positive moves or changes. And the other way applies – when the scores are below the center line, prices make negative moves – or simply fall.
There’s also another simple r way to analyze the ROC indicator readings. Above the center or mid-line zero, prices make uptrends. While readings below 0 or the signal line, see prices making downtrends.
So basically, the rate of change ROC readings help investors interpret whether the underlying market is either oversold or overbought.
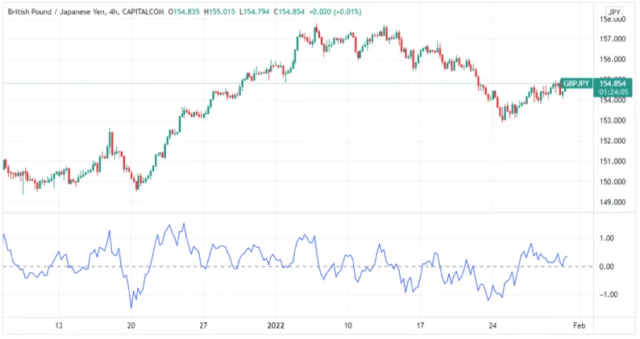
Above, you can see a screenshot showing the ROC indicator – showing as the graph at the bottom pane of the GBP/JPY price chart picked from the TradingView platform.
| Broker | Best For | More Details |
|---|---|---|
| securely through TradingView website |
How to Trade using Rate of Change Indicator
The ROC indicator tracks the rates of change in prices and has a unique nature – which suits it for helping out traders with three separate key planes of price action analysis:
- ROC indicator helps with the identification of price trends
- ROC helps with spotting the build-up of a market reversal or change from the current one
- ROC also helps with tracking market divergence in price charts
As you can see, looking at the above three sets of technical and analytical approaches, traders have a better predictive grasp of what is happening with the prices of a stock or asset in the financial markets.
To add more emphasis to a point shared earlier on, regards the approach to interpretations of the ROC indicator scores.
Simply approach the readings from point plotting as the center line labeled as zero. So you read and interpret the score depending on which side it lies from the midline – whether its values are positive or negative.
ROC Indicator in Trend Identification or Confirmation
First, the ROC is an indicator of the rate change in price with time falls in the list of momentum indicators.
Therefore, in terms of the readings, the price can be around the mid-line zero or above or below it.
ROC readings, where the price concentration is around the center-line region, point towards choppy markets, consolidating or, in other words, trading in a sideways fashion.
ROC readings above line zero indicate bullish momentum in a market – an indicator moving upwards. And, of course, ROC readings below zero indicate bearish momentums.
The other way to interpret the market readings using the ROC indicator is working by reading from extreme scores – reading away from the center-line 0.
So, with an extreme positive score, ROC will point towards confirmation of an underlying bullish trend or upward price momentum. And, of course, extreme negative readings of the ROC point to a conformation of an underlying bearish trend or steep price decline.
Whenever ROC indicator readings concentrate around the region of the center-line zero, interpret that as a consolidating market. And, you can best stay out of the markets and only work with reasonable breakouts or clear trends.
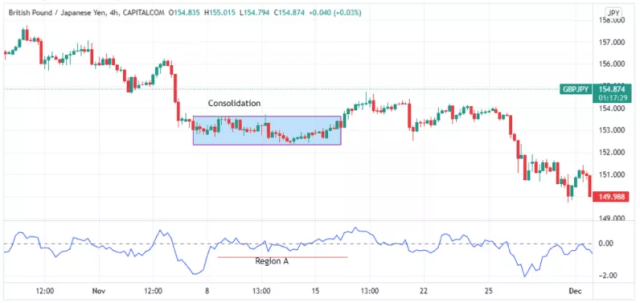
Concerning the chart image above, see how the ROC readings concentrate around the centre line – corresponding to the market consolidation at the corresponding timeframes.
ROC Indicator in Trend Reversals
ROC indicator works best with spotting trend reversals as the tool shows clear signals in line with the changes.
ROC helps with trend reversals from the quality of being a momentum indicator or oscillator – capturing the rates of change in prices. Therefore, it helps classify the underlying market as either overbought or oversold levels.
In line with each case above: Overbought markets are speculatively ripe for bearish reversals. Oversold markets are speculatively ripe for bullish reversals.
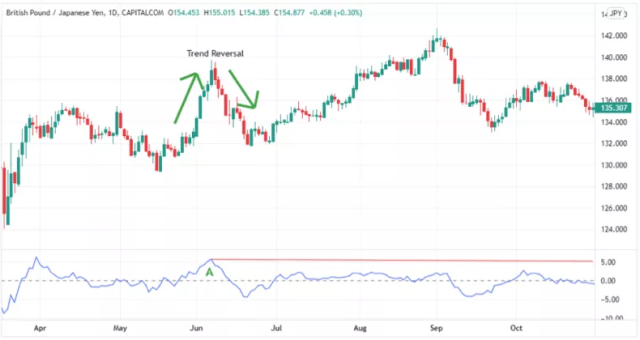
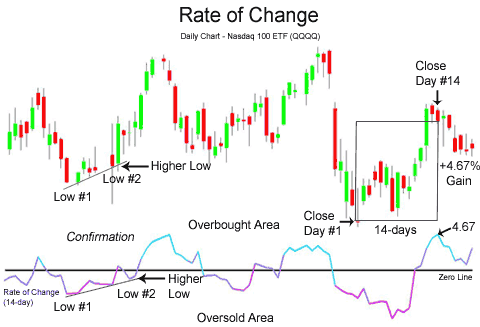
Looking closely at the above image, notice the reactions around the region with the letter A on the ROC indicator plane.
Notice the corresponding reactions with prices at the same region with very high positive readings -serving as a sell signal. Next, the prices make an apparent trend reversal – from bullish to bearish.
In case price momentum keeps rising, it confirms as a trend confirmation. As the momentum grows weaker – the dominant trend loses steam.
Additionally, upward surges in momentum signal bullish breakouts, while downward plunges in momentum signal bearish breakouts. Very strong momentums indicate sustainable trends – either way.
The reversal signals with ROC crosses around the zero or center line. For bullish trends, the ROC oscillator crosses the line from below. Conversely, for bearish trends, the ROC oscillator crosses the midpoint line 0 from above for bearish trends.
Note: The best way to capture valid trend reversal signals is via combining the ROC indicator with other complimenting ones like the Relative Strength Index.
ROC Indicator as a Divergence Indicator
It’s good to note that divergence is not the best approach to help predict trend reversals. However, working with other indicators helps improve the predictions. And one good combination here is the moving averages.
Working with the rate of change ROC will help spot divergences within ranges.
The best way to describe a divergence is whenever prices move in a direction opposite to what an indicator shows.
Therefore, concerning the above, a bullish divergence shows up when asset prices are falling, yet ROC indicator scores are rising. And bearish divergence also shows up when prices increase, yet the ROC indicator is falling.
Whenever bullish divergences occur, it points toward bearish reversals. And when bearish divergences occur, it points to bullish reversals.
Looking at the above scenarios, the best way to work around divergences is to analyze price action concurrently with other technical indicators.
How to Calculate ROC
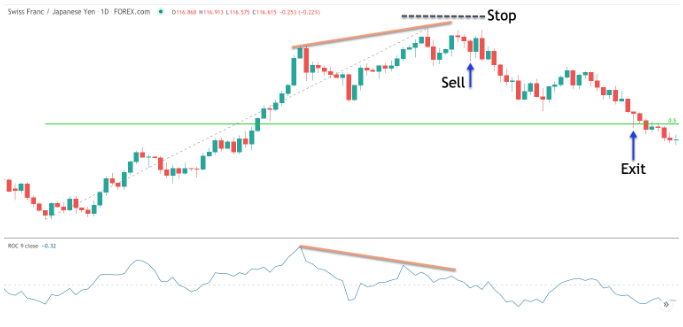
The ROC calculates the rate of change in prices over e set number of periods -starting with the current one.
With the above point in mind, it’s therefore crucial to have a precise number of periods to work with or analyze by looking backward into timeframes. Once you have your ideal number of periods to analyze, you are set.
Short-term traders – day traders and scalpers- can work with fewer timeframes, like around 9. However, long-term traders like those on swing trading need to work with a bigger number of timeframes for the analysis.
As regards the actual calculation, ROC calculates using a current period closing price, plus those of price n periods ago as you have specified. Here, the n stands for the specific number of periods you set to analyze backward.
Here below is the actual formula for the calculation of the ROC:
The above formula helps you grasp the inner details of how the ROC indicator scores are arrived at.
However, you’ll not be required to do the manual calculations since most trading platforms incorporate it as an add-on within the trading software.
And by default, most platforms have the settings picking on 14 periods. It’s worth noting that you can adjust the periods to help you capture one that best suits your trading strategy. But most analysts pick at least 9 periods, and the highest ones pick 200 periods.
Note on ROC Indicator Periods
You may wonder what the best period to capture or set in your calculations is. And you have to remember that the ROC’s smoothness depends on the longer number of periods you use.
ROC typically has a slow reaction relative to price movements. Therefore, experts guide that longer analysis periods give far more precise scores than shorter periods. In other words, short analysis periods via ROC are more prone to false signals.
ROC Indicator – Trading Rules and Interpretation
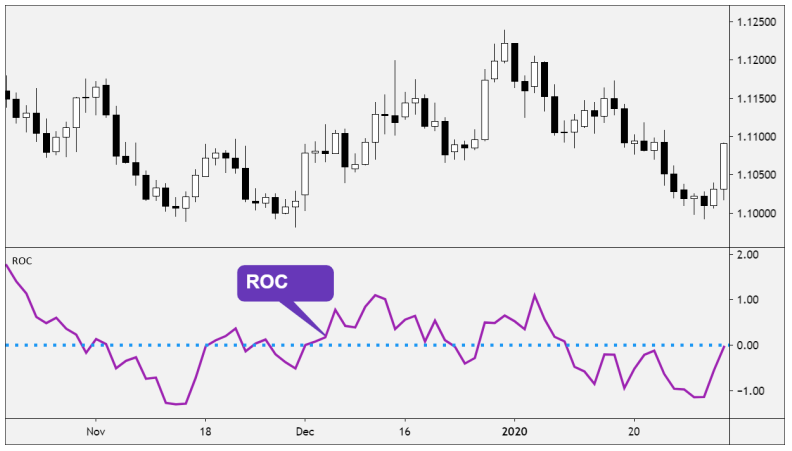
Here are the rules to help you interpret ROC indicator readings in light of a price move and trend changes more precisely:
#1. ROC higher than zero (positive territory) plus keeps rising, showing an uptrend whose speed is accelerating.
#2. ROC higher than zero, yet falling, shows an uptrend with declining speed.
#3. ROC reading above the zero line but starts rising higher (sharp price advance) and crossing a previous high point shows an uptrend with very high speeds.
#4. ROC, below the zero line yet falling, shows a downtrend with increasing speed.
#5. ROC, below zero (negative territory), yet starts rising upwards, showing that the speed of a downtrend is slowly declining.
#6. ROC below zero plus starts falling, shows the downtrend with accelerating speed again
ROC Indicator Limitations
The biggest limitation with ROC is attaching the equal weight to the most recent period and that of the nth periods backward for an underlying asset to calculate roc values.
The other challenge comes with consolidating markets – there’s no clear signal with respect to future price movement.
ROC can give mixed and false signals with divergences. Therefore, it’s key to confirm the signals with other complementing indicators to enrich the analysis.
Best Forex Trading Course

The One Core Program by Asia Forex Mentor is the best Forex course that takes trainees from beginners to advanced traders in a systematic process. It’s a culmination of expertise of not less than 20 years of practical exposure to the financial market by Ezekiel Chew – the lead trainer.
It helps trainees garner life-long skills to take on the markets and close with profits hitting 6 figures per trade. The course builds on a market analysis process that builds on the mathematical probability that’s proven to build ROI positively.
In the past, the One Core Program has been of benefit to retail traders and more from trading institutions and globally reputable banks.
| RECOMMENDED TRADING COURSE | REVIEW | VISIT |
|---|---|---|
 | #1 Forex, Crypto and Stocks trading course. Ranked most comprehensive by Investopedia and Best by Benzinga. Free to Try! |  |
Best Forex Broker
| Broker | Best For | More Details |
|---|---|---|
 |
| securely through Avatrade website |
Conclusion: ROC Indicator
ROC indicator measures the rate of percent change in price with time for a selected number of periods or timeframes, as traders prefer.
It serves short-term traders who can track 9 periods backward to long-term traders who can track 200 periods backward.
In appearance, it is a momentum oscillator with a middle line zero. Traders can use it to confirm trends, note the build-up of trend reversals as well as monitor consolidative markets.
Lastly, the ROC indicator is helpful if one can read and configure it correctly. Yet, for best results, put more effort into bringing in more indicators to help weed out false signals. Plus, traders should not assume that roc calculation compares to investment advice.
ROC Indicator FAQs
Is ROC Indicator Profitable?
The rate of profitability with ROC indicators depends on several factors. Correct settings, interpretations, and fitting the readings to a reliable trading strategy.
Of course, profitability also increases with correct risk and money management practices while trading.
What is ROC Trend Confirmation Strategy?
ROC helps with confirming dominant trends. Therefore, traders can take opportunities along trends or anticipate those that come with trend reversals.
Traders can choose to make the ROC indicator a core part of their trading strategy or fit it within other analysis methods and trading strategies.
What is the volume ROC Indicator?
The ROC indicator captures volumes of changes in price over specified timeframes – it’s the market momentum.
Traders can complement their market analysis with other two indicators to upscale their abilities to capture correct signals.
Wilbert S
Wilbert is an avid researcher and is deeply passionate about finance and health. When he's not working, he writes research and review articles by doing a thorough analysis on the products based on personal experience, user reviews and feedbacks from forums, quora, reddit, trustpilot amongst others.


