Dow and Nasdaq Slip, Dax Retreats from Recent Highs
By Daniel M.
January 5, 2025 • Fact checked by Dumb Little Man

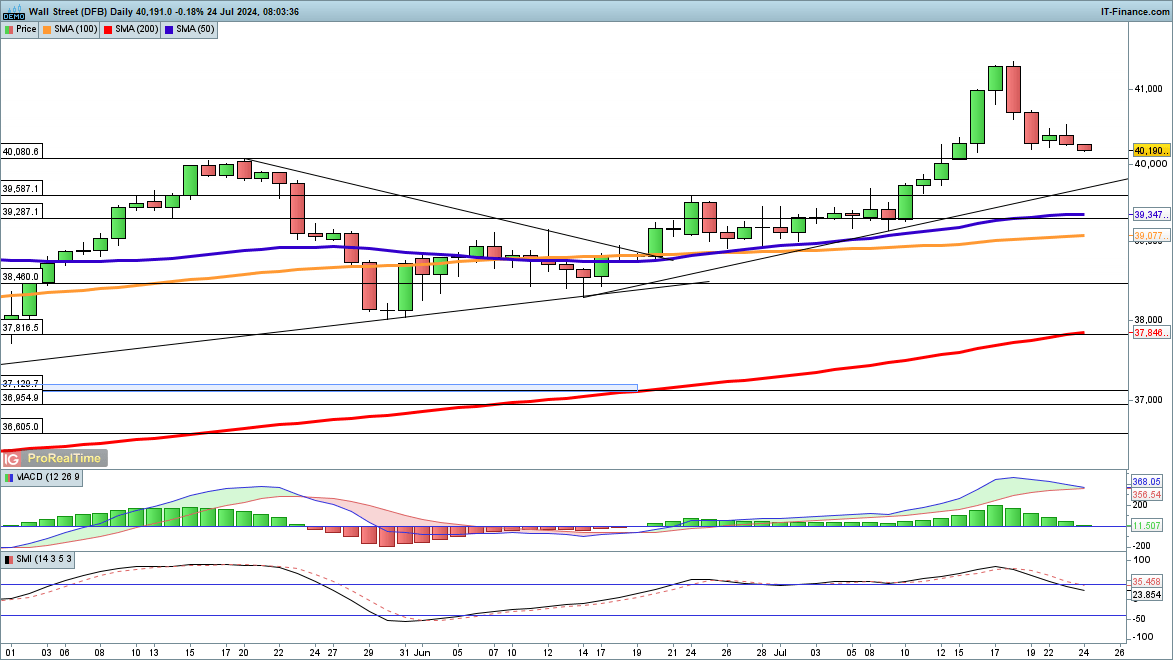
Dow Declines Further
The index has resumed its downward trend, breaking below Friday’s low and approaching the previous highs at 40,080.
Further declines below this level could lead to trendline support from the June low, and then down to horizontal support at 39,587.

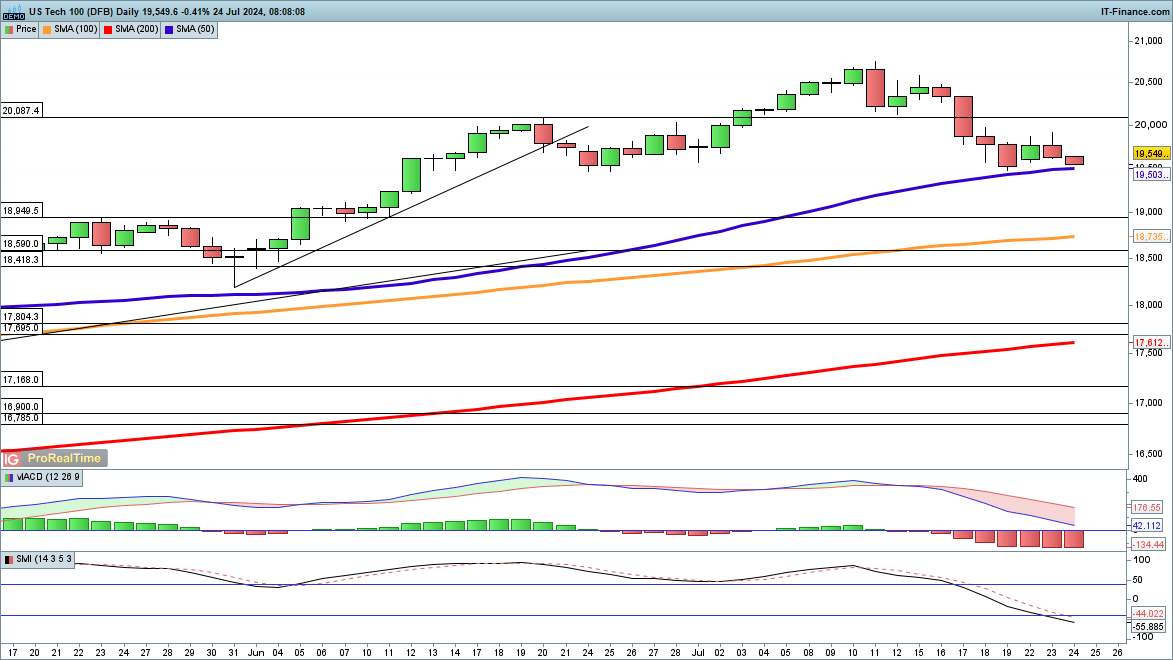
Nasdaq 100 Weakens
Hopes of a rebound have diminished here, though the index is holding above the 50-day simple moving average (SMA), currently 19,503. A close below the 50-day SMA would signal a new short-term bearish phase, targeting the previous highs at 18,949.
Buyers will need a close back above 19,900 to indicate a potential upward push.

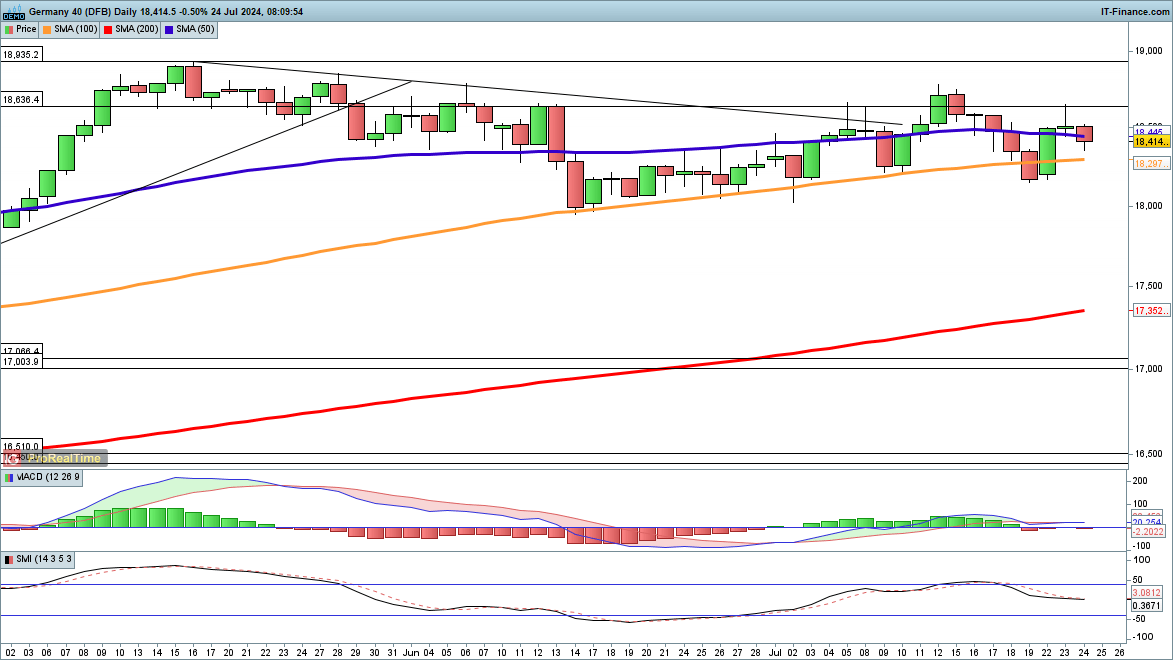
DAX Pulls Back from Peaks
This index managed to reach a one-week high on Tuesday before pulling back. It remains above Monday’s lows, but a close today below the 50-day SMA would increase short-term pressure on the price.
This could then test Monday’s lows around 18,150, before potentially moving on to the June lows at 18,000.

Daniel M.
Daniel Moore is a seasoned trading analyst with over 20 years of experience navigating the ever-evolving financial landscape. Renowned for his unconventional yet effective approach, Daniel utilizes a blend of technical and fundamental analysis to identify hidden gems and craft winning trade strategies. He is a master at demystifying complex market data and translating it into actionable insights for traders of all experience levels.

