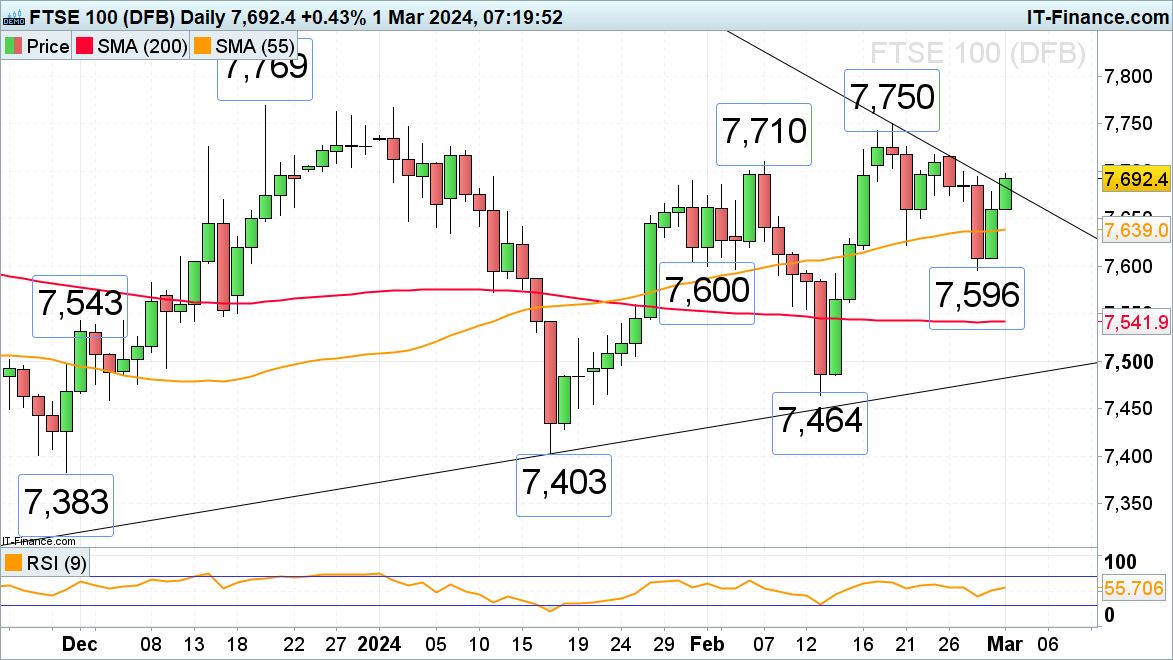
FTSE 100 Aims for 7,710 to 7,769 Range
The FTSE 100 shows a bullish momentum from the recent low of 7,596, targeting the early February peak of 7,710. The next resistance is between 7,750 and 7,769, marked by the highs from December to February. To approach this zone, the index must surpass the 23 February high of 7,717. Support is found at the previous session’s low of 7,660 and the 55-day SMA at 7,639.
FTSE 100 DAILY CHART

IG Retail Sentiment shows daily and weekly changes in client positioning
DAX 40 Set for Sixth Consecutive Record
The DAX 40 continues its ascent, aiming for a new high around 17,800, driven by the latest earnings revealing European stocks as undervalued compared to U.S. counterparts based on PE ratios. This insight has spurred additional investments into Germany’s market. Support is identified at the accelerated uptrend line near 17,628, with sights set on the 18,000 level.
DAX 40 DAILY CHART
Nasdaq 100 to Break Past February Highs
On the opening of March, the Nasdaq 100 is poised to exceed its February high near 18,100, targeting a new record. The immediate goal lies in the 18,200 region. Support ranges from 18,097 to 18,043, as delineated by the February highs. With the week’s low at 17,791 as a foundation, the medium-term upward trend remains secure.
NASDAQ 100 DAILY CHART
Final Thoughts
FTSE 100, DAX 40, and Nasdaq 100 indices demonstrate strong bullish trends, with each targeting new highs in their respective markets. The FTSE 100’s focus on overcoming key resistance levels, the DAX 40’s continuous record-setting trajectory fueled by undervalued European stocks, and the Nasdaq 100’s push towards surpassing previous highs underscore a robust investment climate.
These trends offer significant insights for investors, highlighting the importance of monitoring these indices for potential opportunities and understanding the underlying factors driving market movements.