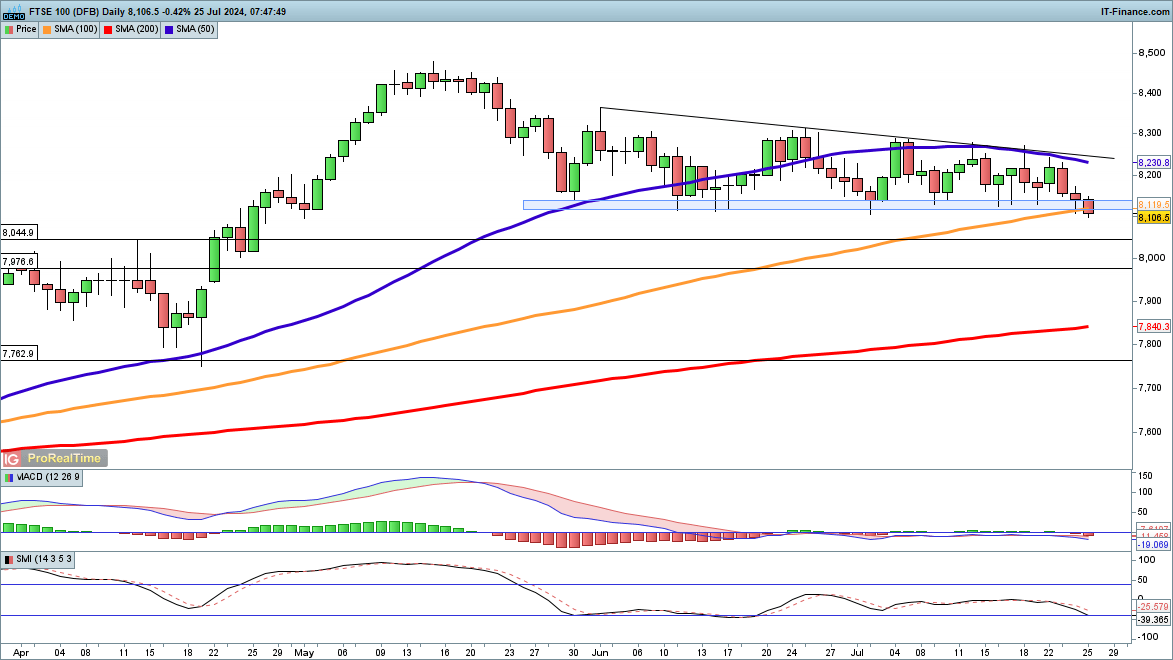
Major global indices are experiencing significant losses, with the FTSE 100 breaking through the support zone at 8120, a level maintained since June.
A close below this level and the 100-day SMA could signal a bearish trend, potentially leading to support at 8044 and subsequently 7976. For buyers to regain confidence, a recovery above 8150 is essential.
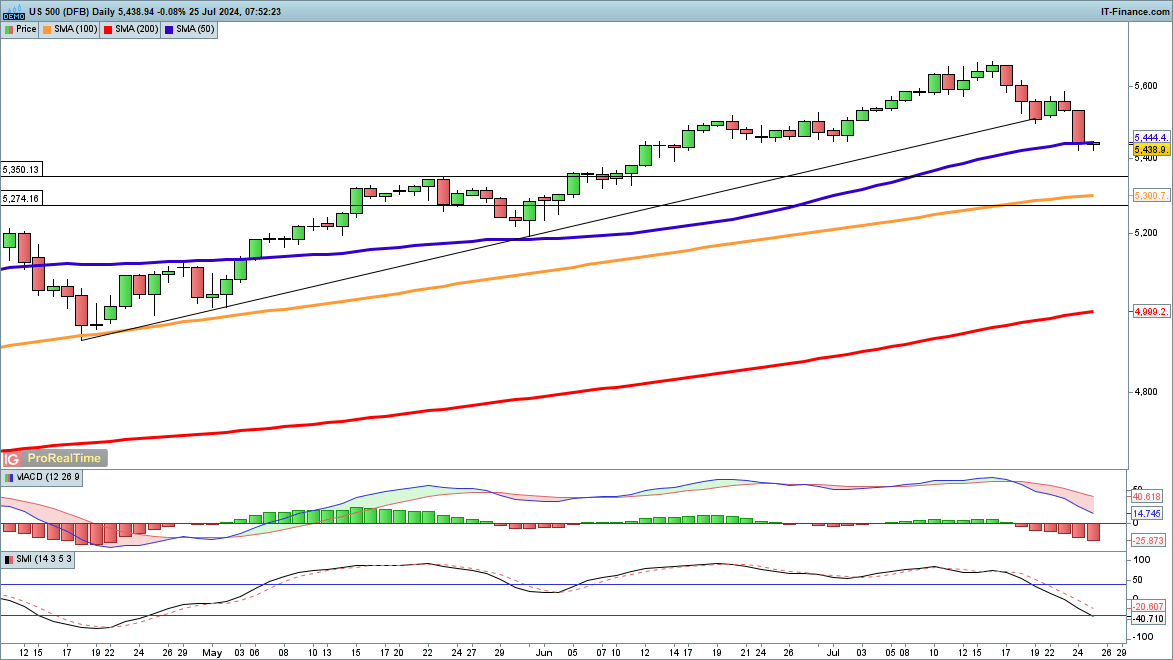
S&P 500 Sees End of Low Volatility Streak
Yesterday, the S&P 500 experienced a 2% drop, ending a 356-day run of low volatility, the longest since 2017.
The index has now fallen to the 50-day SMA for the first time since late May. If the decline continues, possible support levels are at 5350 and then 5274. Conversely, a short-term close above 5500 could indicate a potential low, setting the stage for a test of recent highs.
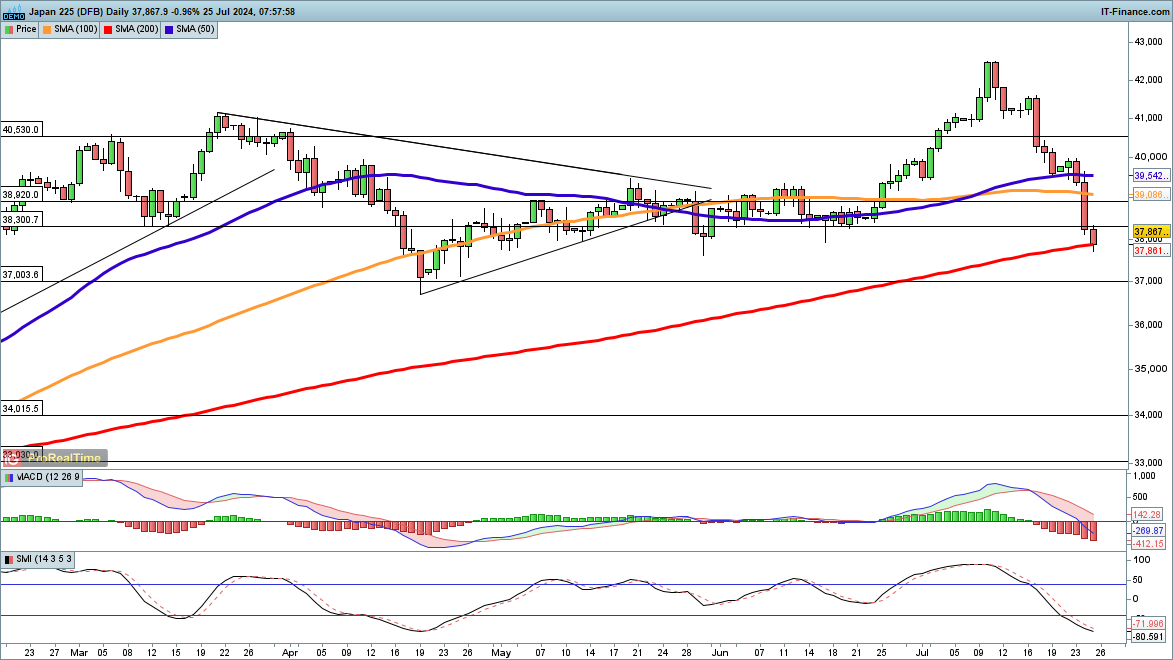
Nikkei 225 Plunges to 200-Day SMA
The Nikkei 225 has dropped 11% from its July peak, hitting the 200-day SMA for the first time since October 31.
This decline erases gains achieved since late June. Further drops could push the index to the 37,000 level, last seen in late April. In the short term, a close above 38,000 might signal a low, but surpassing the 39,000 area from May and June is crucial for a sustained recovery.