

Let’s just say it—your phone alarm isn’t doing the job. If you’ve ever slept through five alarms and woken up with one sock on and your hair looking like it fought a tornado, welcome to the club. As someone who has tested more clock app settings than most people have hot meals, I’ve got some strong opinions on how to fix this mess. Your device has the potential to be your wildest morning coach if you set it up right. So buckle up sleepyheads, because I'm serving up real alarm hacks that actually work.
Why Your Phone Alarm Isn’t Working (and Why It’s Not Totally Your Fault)
Before we get into the juicy alarm hacks, let’s figure out why your clock app is flopping. For starters, most people just hit “set alarm” without touching the settings or volume. That default alarm sound? It’s basically a gentle suggestion, not a wake-up call. You need features that slap, not whisper.
Sometimes the issue isn’t the alarm, it’s your device. Whether you’re on Android or iPhone, these devices have so many settings tucked into corners you’d need a flashlight and a support group to find them. And don’t get me started on low volume, blocked alerts, or weird account syncing. Bottom line: it’s not just you, it’s your setup. But don’t worry, we’re going to change that.
Hack #1: Customize Your Alarm Sound Like It Owes You Money

If your alarm sound is still that soft twinkle noise, it’s no wonder you’re still sleeping. That sound wouldn’t wake a cat, let alone a full-grown human who’s been up streaming all week. The fix? Choose a sound that’s borderline offensive. Seriously, the goal here is not to feel calm, it’s to get your body out of the bed.
Go into your clock app, hit edit, and then change that sleepy tune to something that sounds like a fire drill. You can even use a custom song if that helps. Pro tip: pick a song you don’t like so you don’t ruin your favorites. Some apps even let you download horror movie screams or obnoxious sounds for free. Whatever you choose, make sure that sound is loud, sharp, and impossible to ignore.
Don’t forget to tap save once you’re done tweaking. You’d be surprised how many folks change the sound, close the app, and then wonder why nothing changed. And hey, if you need a backup, set multiple phone alarms with different sounds. Let one scream, and let the other insult you. Just make sure they all actually go off when they should.
Hack #2: Use Multiple Alarms (Strategically, Not Like a Maniac)
Okay, let’s talk about multiple alarms. Yes, they work, but not if you set 10 of them one minute apart. That just teaches your brain to ignore alerts. Instead, space out 3 to 4 scheduled alarms over a 20-minute window. Start with one alarm that gently gets your brain moving, then follow it up with louder, more aggressive sounds.
This method keeps your body from being jolted awake, but still forces it into action. You can use your clock app to set these easily—just make sure the volume is cranked up and the alarm sound is different for each one. No repeats allowed. If they all sound the same, your brain goes into ignore mode.
Pro tip: Put your first phone alarm at the start of your wake window, not the end. That way, even if you hit snooze, you’ve got a few more chances before chaos kicks in. Oh, and don’t forget to label each alarm with something threatening, like “GET UP OR YOU’RE FIRED.”
READ ALSO: 5 Reasons To Workout Right After The Alarm Clock Rings
Hack #3: Set Alarms for Certain Days Only (Because Weekend Sleep Is Sacred)
If you’re setting your alarms manually every night like it’s 2004, we need to talk. Your clock app has this magical thing called scheduled alarms—and it’s honestly life-changing. You can set an alarm to go off on certain days only, like weekdays, and leave your precious weekends untouched. No more waking up at 6AM on a Saturday just because you forgot to turn it off.
To do this, open your clock app, edit your existing alarms, and choose the days you actually need to wake up. Tap through the settings until you see the repeat options, and you’re good. This not only improves your sleeping schedule, but also helps reduce that nasty moment when your device buzzes too early on a quiet Sunday.
Want to be extra? Set a totally different phone alarm sound for the weekend in case you need a backup alarm. Something calm and soft—like bird chirps or ocean waves—so it doesn’t feel like an emergency. And don’t forget to tap save. It’s the tiniest button but makes the biggest difference.
Hack #4: Use the Label Feature to Mentally Guilt Trip Yourself

If you’re ignoring your alarms like a champ, it’s time for some emotional blackmail. That’s right—labels. The clock app lets you set custom names for your alarms, and this is your chance to go wild. Label your 7AM alarm with “You’ll Regret This in 10 Minutes” or “Late Again? Not Cute.”
These mini guilt trips actually trick your brain into caring. Seeing that reminder right when you’re tempted to hit the snooze button can help you pause and reconsider. And yes, it absolutely works better than generic alerts. Make it funny, make it threatening, just make it personal. Because the alarm won’t get you up, but shame might.
To add a label, go into your clock app, hit edit, and scroll to the label option. Type whatever insult or pep talk you need, then tap save. And don’t forget to rotate them every week to keep your brain from tuning them out. Keep it fresh. Keep it spicy. Keep it judgmental.
Hack #5: Adjust the Volume and Vibration for Maximum Annoyance
Let’s talk about your volume. If your phone alarm is set to whisper, don’t be surprised when you sleep through it like it’s a bedtime story. Go into your clock app, smash that settings button, and crank the volume like you're the DJ of your own rude awakening. You can also toggle the vibration on, because nothing says “GET UP NOW” like your entire device doing a mini earthquake on your nightstand. Combine both and you’re basically impossible to ignore.
If you’re a heavy sleeper, this combo is a must. You can even change the alarm sound to something chaotic and pair it with aggressive vibration. Play around with it every week until you find the one-two punch that gets you out of bed. And don’t worry, your phone won’t break from being a little loud. That’s what it was made for.
Lastly, test your phone alarms before bed. Hit alarm open, set the time a few minutes ahead, and give it a test run. Make sure both sound and vibration are working, because sometimes devices get weird. If it doesn’t shake the soul out of you, it’s not ready. No mercy when it comes to waking up.
READ ALSO: Choosing the Best Mattress For Side, Back, and Stomach Sleepers
Hack #6: Use the Snooze Button Wisely (or Not at All)
Ah, the infamous snooze button—aka the enemy of productivity. Listen, I get it. That extra five minutes feels like magic. But those sweet minutes add up fast and next thing you know, you’re running out the door with your shoes in your hands. If snooze is part of your daily routine, it’s time for a reset.
You can actually edit the snooze settings in your clock app or just turn it off altogether. Yes, really. Some people need tough love, and disabling the snooze button might be the kick they need. You can also trick your brain by setting one scheduled alarm with no snooze, and a second louder one a few minutes later just in case.
And for the brave souls who want to keep it? Limit your snooze to just one or two taps max. Any more than that and you’re just dragging out the pain. Choose your time, set the rule, and stick to it. No excuses, sleepyhead.
Hack #7: Delete Old Alarms and Clean Up Your Clock App

Let’s take a moment to talk about alarm clutter. If your clock app has 27 different phone alarms from the past year, it’s time to delete some stuff. Old alarms take up space, confuse your brain, and make it harder to actually set and manage what matters. You know that one labeled “Wake up for 2019 exam”? Yeah, it’s gotta go.
Open the clock app, scroll through the mess, and tap delete like your sleep depends on it—because it kinda does. Clear out everything that’s outdated or unused. Then go back in, create new scheduled alarms, and label them properly. This helps boost performance, and your future self will thank you.
Also, clearing your alarms keeps things neat when you change alarms or update your device. No more second-guessing which one is active. Trust me, being organized with your clock app is more powerful than you think. So yes, tap delete. Clean clock, clean mind.
Hack #8: Try Alarm Clock Apps That Actually Do the Most
Let’s be real: your default clock app might just be too basic for your chaotic sleeping habits. That’s why third-party alarm clock apps exist, and some of them are wild—in a good way. There are apps that make you solve math problems before the alarm stops, apps that won’t shut up until you take a photo of your sink, and even ones that yell motivational insults at you. If that’s what it takes, so be it.
Start by looking for highly-rated alarm clock apps on your smartphone’s app store. Check if they have options to set phone alarms, adjust volume, use custom sounds, or disable the snooze button. Some even let you connect to other devices, like smart lights or cameras, to go full tech-mode. And yes, some are free, others are paid, so choose what fits your vibe.
These apps are also great if your clock app crashes or fails to implement your settings correctly. Just make sure you allow proper access to notifications and alerts so it actually wakes you up. And once you find the right one? Stick with it. You’ll finally stop oversleeping—and maybe even become a morning legend.
READ ALSO: Wake Up! Five Ridiculous Alarm Clocks
Hack #9: Put Your Phone in a Glass for a DIY Volume Boost
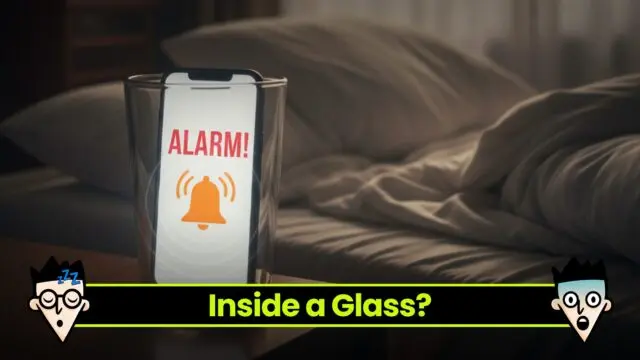
Here’s one of my favorite low-effort, high-reward tricks—place your phone inside a glass or mug overnight to boost the alarm sound. I’m serious. It works like a budget speaker and turns your regular device into an obnoxiously loud alarm clock. The shape of the glass helps amplify the sound, which is perfect if your volume is always at max but still somehow not enough to wake the dead.
To try this, grab a dry, empty glass (ceramic or thick plastic works best), and gently place your smartphone inside with the speaker facing down. Make sure the alarm is set and that you don’t block any important buttons. This DIY speaker trick boosts the sound without needing to download or install any fancy apps. And yes, it’s helpful when your usual alarm clocks are too weak.
This hack is perfect for travel, dorm rooms, or even your home nightstand. Just be cautious not to knock it over in your sleeping chaos. Combine it with other hacks like a custom phone alarm sound or placing your device across the room, and you’ll have a wake-up strategy that’s impossible to ignore. It’s loud, it’s cheap, and it just works.
Hack #10: Put Your Phone Somewhere Annoying (Like Across the Room)

Last hack? Location, location, location. If your device is right next to your bed, your half-asleep hand is going to tap that alarm off before your brain even boots up. That’s why the old “put your phone across the room” trick works like magic. It forces you to actually get up, walk, and then deal with the alarm. And once you’re up, the hard part is over.
You can also place your phone in the bathroom, on a shelf, or even next to your coffee machine—yes, that’s a real thing people do. Just make sure the volume is high and the alarm sound is something wild. You don’t want to sleep through it because you went with something calm and sweet. No, you need chaos.
And if you live with others? Warn them. These sounds can be brutal—but they’re effective. Just remember to always set, edit, and tap save after moving your device. No point in being dramatic if the alarm doesn’t actually go off.
Key Takeaway: The Alarm Struggle Is Real—But You’ve Got Options
Let’s be honest—waking up is hard. But with the right alarms, the best settings, and a few creative tricks, it can be less of a struggle. You’ve got everything from scheduled alarms and annoying alarm sounds, to clever apps, volume hacks, and strategic phone placement. Use them. Love them. Conquer your mornings.
Whether you’re a chronic snooze abuser or just trying to stop being late every day, these hacks are here to help. You don’t need to be perfect—you just need to be consistent. So go set those alarms, edit those labels, and please, for the love of coffee, tap delete on the ones that no longer make sense.
Your mornings are about to change. No more being the person who says “I overslept” like it’s a personality trait. You’ve got the tools. You’ve got the device. Now go hit that phone alarm open and actually show up for your life.
UP NEXT: How to Fall Asleep Fast: Complete Guide 2025
Frequently Asked Questions
1. Why isn’t my phone alarm waking me up?
There are a few reasons your phone alarm might not be doing its job. The most common issue is that the alarm sound is too soft or the volume is turned down. Sometimes your device settings block notifications or alerts, which stops the alarm from ringing properly. It could also be that your clock app is buggy or your scheduled alarm isn’t actually saved (always make sure to tap save). Try changing the alarm sound, adjusting the volume, and double-checking your settings to make sure everything's ready for your next wake-up call.
2. What are the best alarm clock app features to wake up faster?
If you’re struggling with waking up, you need a clock app with powerful alarm features. Look for apps that let you set multiple scheduled alarms, customize alarm sounds, and even require you to do something annoying—like solve a puzzle or take a picture—to stop the alarm. Great apps also offer increasing volume, strong vibration, and advanced settings to tailor your alarm to your sleeping style. The best alarm clock apps are the ones that make it nearly impossible to ignore your device in the morning.
3. How do I schedule alarms on my phone for certain days only?
To schedule alarms for specific days of the week, open your clock app, go to your alarm, and hit edit. Most apps have a repeat or days option where you can choose which day the alarm should go off—like weekdays only or weekends only. This helps you avoid getting woken up early when you don’t need to be. Just make sure to tap save after picking your days, or your device won’t remember the changes. It’s an easy way to keep your sleeping routine on track without having to manually set alarms every night.


8 Responses
Quality posts is the important to be a focus for the
viewers to visit the web page, that’s what this site is providing.
Comments