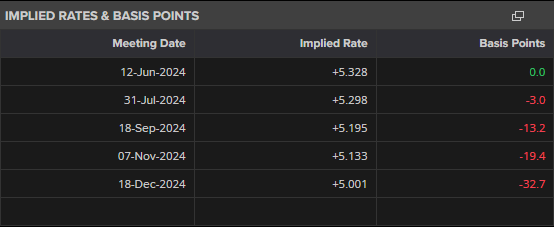
This week saw a significant auction of 2-, 5-, and 7-year US Treasuries, totaling $183 billion, which encountered weak demand, elevating yields considerably over the past two days.
These heightened UST yields, alongside rising anticipation that the Federal Reserve may limit rate cuts to just once this year, have propelled the US dollar upwards, negatively impacting commodities including gold.

Today, the US Bureau of Economic Analysis (BEA) is set to unveil the second estimate of the US Q1 GDP at 13:30 UK, with the Core PCE Price Index for April scheduled for release on Friday. This index is the Fed’s preferred inflation gauge. Both indicators are pivotal and can significantly influence gold prices.
After reaching a multi-decade peak of $2,450/oz. last week, gold has since retreated to approximately $2,333/oz. The daily chart identifies the 23.6% Fibonacci retracement at $2,284/oz., with additional support nearby at $2,281/oz.
Should gold face further declines, these levels are expected to offer support. A decisive dip below these points could target the $2,200/oz. level and the 38.2% Fibonacci retracement at $2,193/oz.
Gold Daily Price Chart
Retail trader data indicates that 60.78% of traders are net-long on gold, with a long-to-short ratio of 1.55 to 1. The number of traders net-long has decreased by 4.66% since yesterday but is up 18.87% from last week.
Conversely, the number of traders net-short has marginally decreased by 0.04% since yesterday and by 1.85% from last week.
Our contrarian view to crowd sentiment suggests that with the majority of traders being net-long, gold prices might continue to decline. The positioning is less net-long than yesterday but more net-long compared to last week, leading to a mixed trading bias for gold.