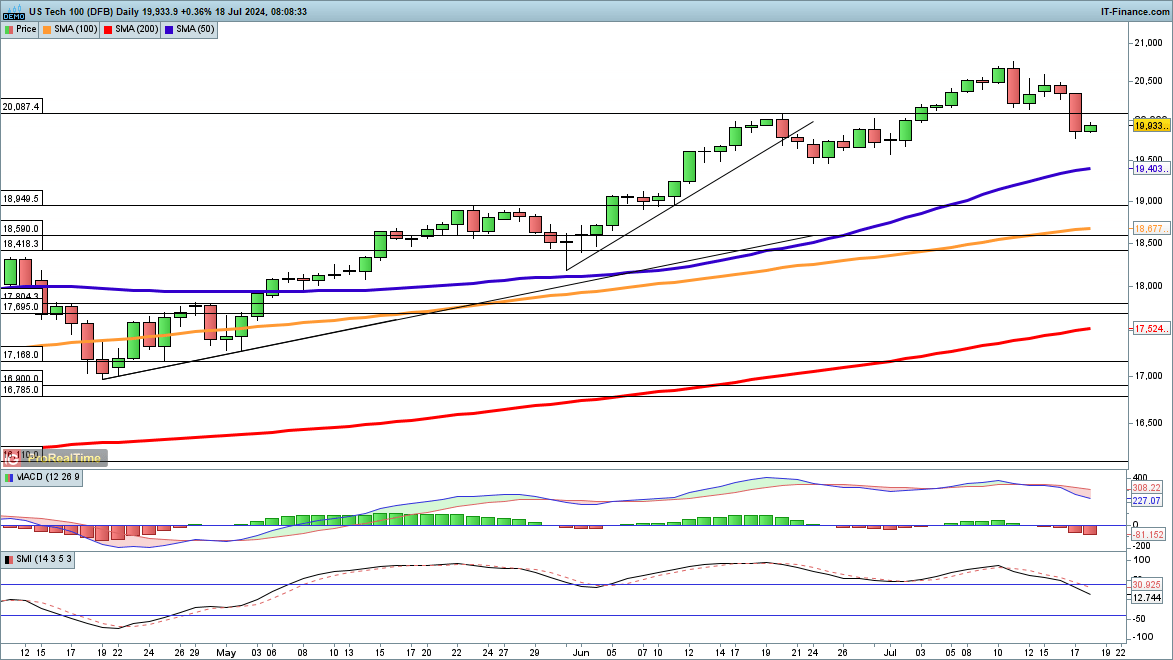
Nasdaq 100 Shows Signs of Recovery
The Nasdaq 100 experienced a drop from recent highs, falling below 20,000 in the previous session. Currently, it finds itself under the June highs, potentially testing the 50-day simple moving average (SMA) at 19,402. The June lows at 19,470 act as a buffer before this level is reached.
A close above 20,000 might indicate that a low has been established.
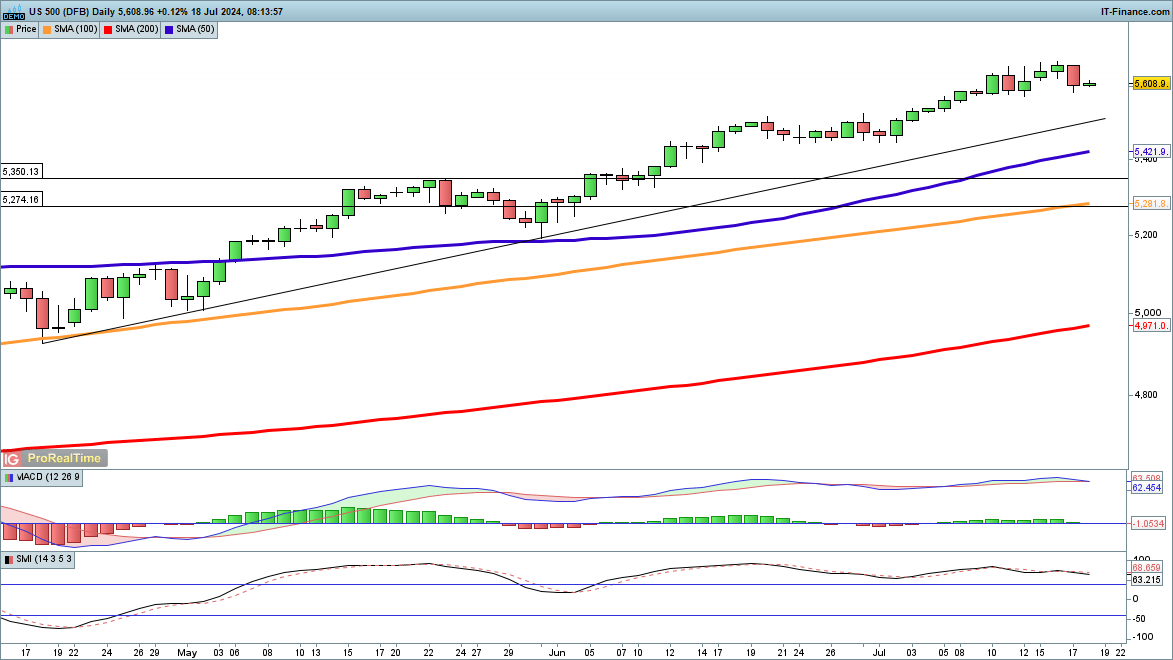
S&P 500 Holds Steady
Despite the volatility in tech stocks, the S&P 500 has only fallen 60 points from its record high. The index is still above trendline support from the April low, with a potential fall bringing it back to 5500, or down to the 50-day SMA at 5421.
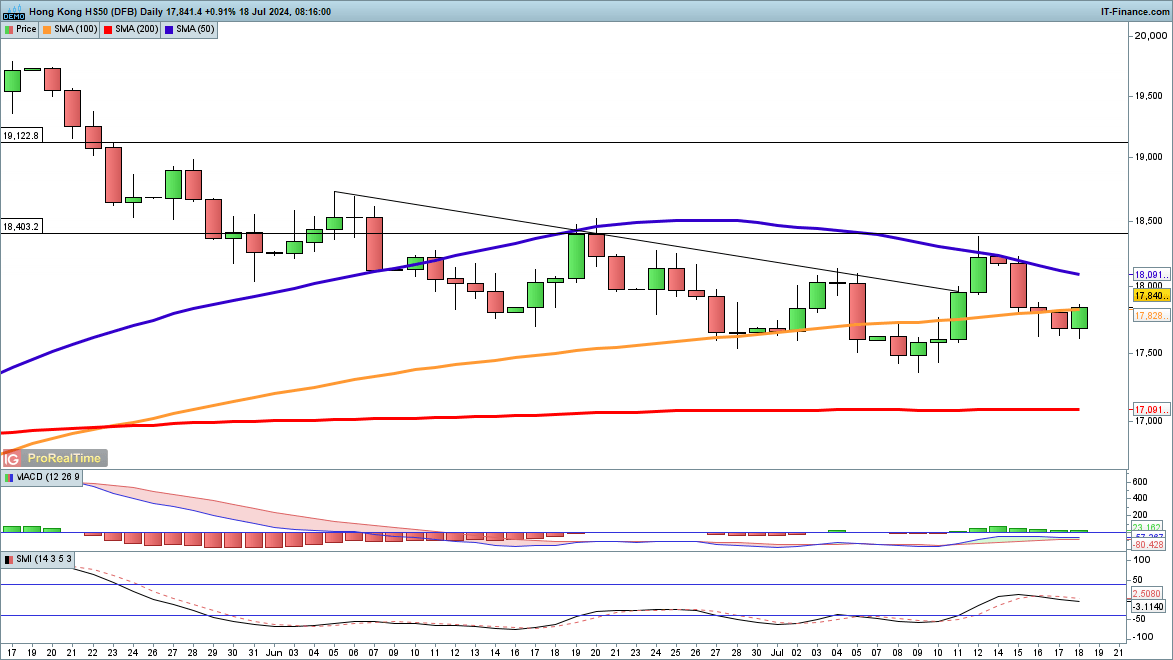
Hang Seng Gains Momentum
The Hang Seng appears to be forming a bottom, rallying overnight after retracing most of last week’s gains. A continued upward movement tests the 50-day SMA, which impeded progress last week. A close above 18,250 and then 18,400 would reinforce a bullish outlook.
Conversely, a close below 17,500 could signal a return to the lows at 17,350.