Ichimoku Article: A Complete Guide On How To Use Ichimoku
By Wilbert S
January 10, 2024 • Fact checked by Dumb Little Man

Want to jump straight to the answer? The best forex broker for traders is Avatrade
The #1 Forex Trading Course is Asia Forex Mentor
Ichimoku is a technical indicator that helps traders predict the direction of a trend and its probable future regions of support and resistance. In long form, it’s the Ichimoku Kinko Hyo, a complex indicator that works with five lines concurrently. Each of the five lines is a calculation of some set of moving averages which we’ll cover in detail.
Grasping how Ichimoku cloud works are initially challenging. But, in this post, we’ll get a finely detailed explanation of the indicator from Ezekiel Chew, a mentor, and trainer of Asia Forex Mentor whose insights are closely followed by retail traders globally.
Ezekiel Chew will delve deep into the components of Ichimoku cloud as an indicator and how traders use it. Also, we’ll get to know the advantages and disadvantages of the indicator and a portion of back-tests done on live market data to figure a probable win/loss estimate using Ichimoku.
As part of the parting note, you’ll find more details about the best Forex course. It’s the end product of 2 decades of expertise guiding willing traders from all walks of life to turn their wheels into profitable trading via the LifeStyle trading approach.
Ichimoku Article: Components of the Ichimoku Explained
You are already aware that the Ichimoku cloud indicator works with five lines, which comprise sets of moving averages. Next, let’s dig into the details of each of the lines (in default settings) that comprise the Ichimoku cloud indicator consists:
#1. First-line in Ichimoku is known as Tekan-sen (conversion line). A good number of traders also refer to it as the conversion line. To arrive at the plot figures, Tenkan-sen is a calculation arrived at via adding the lowest low and the highest high for the last nine periods, and the result is divided by two. Tekan-sen is a signal line and also shows key areas of either support or resistance. It also guides traders to plot a reasonable estimate for placing their stop loss positions.
#2. The second line in the Ichimoku cloud indicator is the Kijun-sen, and many traders also refer to it as the baseline. Kijun-sen is arrived at by working with the highest high prices, which are added to the lowest low prices for the last 26 periods and dividing the sum by two. Kijun-sen plots the key support and resistance levels and helps confirm changes in the directions of trends. Traders can use Kijun-sen to place trailing stop loss positions.
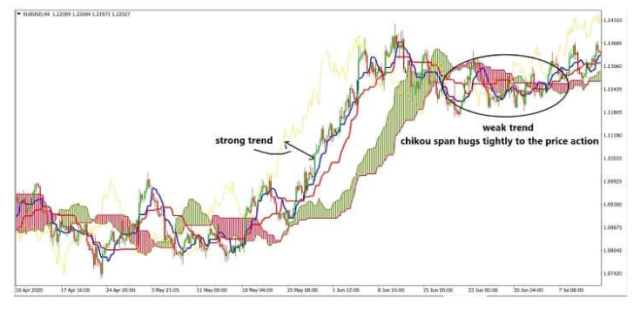
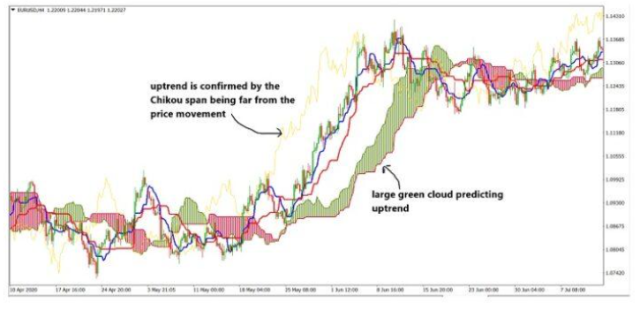
#3. Chikou span is the third line of the Ichimoku cloud indicator, and a good number of traders call it the lagging span. Chikou Span represents or shows the closing price of the current period plotting backward for 26 days. Apart from showing the possible areas of support or resistance, the Chikou span or the lagging span shows strength in a trend and therefore helps traders to avoid consolidating or choppy markets. If the Chikou span or lagging span is far away from the price lines, the stronger a trend is.
- Senkou span is the fourth of the five lines in Ichimoku. Senkou span is also known by the term – leading Span A. To get the figures for the Senkou span, tenkan-sen and kijun-sen are added together, and the result is divided by two and plotted for 26 days as a projection. The line that results from the Senkou span forms one of the edges of the Kumo or the cloud, which shows possible future areas of support or resistance.
- Senkou span B is the last of the five lines in the Ichimoku cloud and is mostly referred to as the Leading Span B. Senkou Span B is the result of adding the highest highs and the lowest lows for the past 52 periods and dividing the result by two. The result is plotted for 26 periods into the future. The line resulting from Senkou Span B for the other edge of the Kumo or cloud identifies possible zones of future resistance or support.
Notice that both the Senkou spans A and B form the Kumo or Cloud. Apart from offering possible areas of support or resistance, it has predictive capabilities.
Traders look at both the size and the color of the Kumo or Cloud as they predict the strengths of future trends to help plan their price action accordingly. Large clouds indicate a strong trend. The future predictive direction of a trend is arrived at by calculations of Senkou spans A and B together, giving the color of the Kumo or cloud and the predictive future price zones.
How to use the Ichimoku?
Under this portion, we’ll look specifically at the rules applicable for trading with the Ichimoku Kinko Hyo strategy. Before opening any trade with the Ichimoku cloud strategy, check on the following conditions:
#1. The Priceline must never be within or inside the cloud or Kumo. When buying or going long, the price line must be above or higher than the cloud. The other way round is also applicable for selling or going short positions, the prices must be lower or below the cloud or Kumo.
#2. Also, when targeting long or buy positions, open when the tenkan-sen makes a crossing above the kijun-sen. For sell or going short positions, you only open when the tenkan-sen makes a crossing to the underside of the kijun-sen.
One key recommendation while trading the Ichimoku cloud strategy is to stay away from choppy markets. Or in other words, when prices are swinging sideways with no justifiable uptrend or downtrend. The main reason to avoid choppy markets arises from the fact that the Ichimoku indicator gives confusing signals. Also, traders cannot gauge momentum and need further technical analysis to help predict price moves.
There’s a way to look at Ichimoku and tell if the markets are consolidating or moving sideways by checking with the Chikou span. And where market momentum slows down and breaks away from the trend and Chikou span tends to converge and move towards the region with candles over the subsequent timeframes.
This accounts for the main reason why Chikou Span is able to gauge the strength of a market. Therefore, whenever Chikou span draws near the price candles, touches them, or makes cross-overs, the market will be trading within choppy or sideway transitions.
In technical analysis, an increase in the green Ichimoku clouds shows an increasing bullish signal, else the red cloud line indicates decreasing momentum signals or bearish signals.
With the Ichimoku chart, you place stop-loss orders by looking at the next positions of support or resistance. You can look out for support and resistance levels where prices respect by analyzing previous price action for your asset or currency pair.
Also, the Ichimoku Kinko Hyo strategy kelps with probable target positions for taking profit when the indicator shows an exit signal. If you are in a buy or a long position, exit when the tenkan-sen or price crosses under kijun-sen. The opposite also holds for selling or shorting positions; exit whenever the tenkan-sen makes a crossing above the kijun-sen.
Pros and Cons of the Ichimoku Indicator
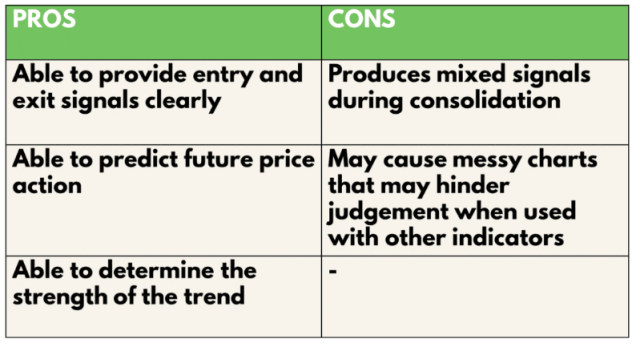
Ichimoku trading strategy comes with a mix of pros and cons. And ideally, it is upon the trader to look at how best they can build on the pros to advance their trading.
At first, it may be complex for beginner traders to navigate around the elements of each of the five lines comprising the Ichimoku indicator. However, it can also be very helpful in ensuring a trader is disciplined enough to analyze the market critically before jumping in.
One key aspect of Ichimoku is the ability to show clear entry as well as exit signals for traders (applies to either a bullish trend or bearish trend). Traders can simply lookup for crossings of the tenkan-sen and the kijun-sen for trend direction and apply them appropriately for any trading signals – either long or short positions.
The other pro of the Ichimoku trading strategy is the ability to make predictions for future price zones for forex traders. Specifically, the Senkou spans A and B show probable regions of future price movements or zones by highlighting the cloud or Kumo. On this note, Ichimoku can also show the strength of a market by highlighting the Chikou span, which deduces the market strength within a trading system.
On the flip side, the Ichimoku cloud chart in trading has a host of flaws. And one is the fact that it’s an indicator that will not help with choppy markets with any trading system to forex traders. In choppy markets, Ichimoku shows very conflicting trading signals, which may end up confusing traders the more.
The most unfortunate portion of Ichimoku is that during consolidating markets, traders can keep opening trades that hit stop losses many times. And that limits the purpose of trading – winning consistent profits that enable account balance growth. In extreme circumstances, a trading account can lose all funds within any trading system.
Although Ichimoku is a single indicator, it can give a messy picture when the lines and clouds scatter on a window. Poor traders have little chance of reading the markets under such scenarios. Bear in mind that with Ichimoku, a trader has to read from each of the 5 lines concurrently. And worse still can come out when trying to work with Ichimoku alongside other indicators.
Analysis
Here is an into detail analysis of the Ichimoku Kinko Hyo trading strategy, with an aim to gauge its profitability potential. The results arise from back-tests on ten trades on the four-hour time frames and comprise ten trades on the 21 of May 2024. The rules for opening the trades remain as they are above for the strategy.
Also, the back-tests will be on three investment vehicles. For Forex, we will pick the EURUSD pair; for stocks, we’ll pick AAPL, while BTCUSD will represent cryptocurrencies. And for simplicity with the size of risks for each, we take the margin applicable to be a flat rate of 1% of an account.
Key Definitions
- Average risk to reward ratio = (The total risk – The reward ratio from winning trades / The total number of winning trades)
- Profitability (In % gain) = (Number of wins X Reward) – (Number of Losses X 1) [ Total Risk of 1%]
Next is a graphical representation of the Ichimoku strategy for the back-tests:
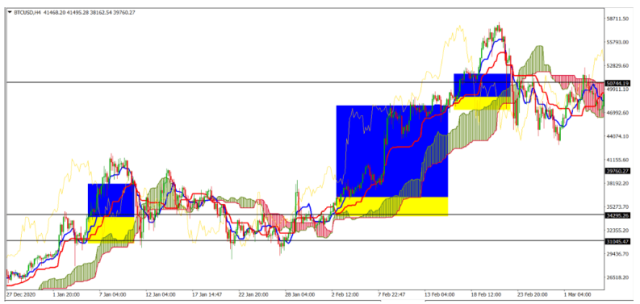
The Key or legend to help analyze the results for the back-test are:
- The trades on areas with shades of blue and yellow are overall wins
- Blue shades indicate the reward region
- Yellow regions indicate the regions of the risks taken
Here are our results showing the win rates for the three investment vehicles as:
- 40% for EURUSD (Forex)
- 70% for AAPL (Stocks)
- 70% for BTC (Crypto)
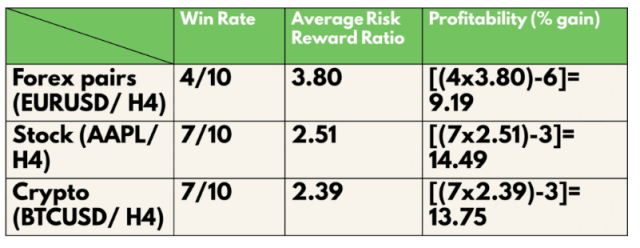
Also, further analysis shows the average risk to reward ratios of the strategy per investment vehicle as:
- 3.8 for EURUSD (Forex)
- 2.51 for AAPL (Stocks)
- 2.39 for BTC (Crypto trading)
Looking at the results from the above analysis, applying the Ichimoku cloud strategy has the ability to help you protect your capital and, on top of it, grow it with the reasonable application of proper market analysis and risk to reward ratios.
Best Forex Trading Course

The world of investment and trading, be it forex, stocks, indexes, commodities, crypto, gold, silver, etc., is becoming competitive day by day. Consequently, each investor, be it a retail trader or a corporate investment company, is looking for opportunities to invest in assets and earn massive returns. Nevertheless, anyone who has stepped into the investment domain knows well how difficult it is to make six figures per trade without learning the method, strategies, and tactics involved in successful trading.
If you want to try your luck in investment and trading in any assets, the first step should be to look for a training course that can successfully guide you through this journey. The Asia Forex Mentor most efficiently provides the best forex training course. Through this amazing course based on mathematical probability, traders do not just make some profit. On the contrary, the pro-traders make massive profits making six figures per trade every time.
The One core program is designed by real traders who have hands-on experience working for banks and major investment institutions. Such expertise makes the proprietary system of the one core program more effective and gives immediate results. In addition, each level of the one core trading course, from beginner to advanced, is customized, keeping in mind the trader’s learning potential, which would eventually help them earn unbelievable trade returns.
To sum up, anyone looking for a comprehensive trading course to earn massive profits in trading needs to take the One Core Program. It is not just a set of strategies backed by mathematical probability to learn from but a complete trading solution with expert advice tweaks and customized expert solutions for every individual client. Thus, the AFM Proprietary One Core Program is the ultimate solution to all your trading needs.
| RECOMMENDED TRADING COURSE | REVIEW | VISIT |
|---|---|---|
 | #1 Forex, Crypto and Stocks trading course. Ranked most comprehensive by Investopedia and Best by Benzinga. Free to Try! |  |
Best Forex Brokers
| Broker | Best For | More Details |
|---|---|---|
 | Advanced Non US Traders Read Review | securely through Avatrade website |
 | Intermediate Non-US Traders Read Review | securely through FXCC website |
Overall Broker | securely through Forex.com website | |
 | Professional Forex Traders Read Review | securely through Interactive Brokers website |
Conclusion: Ichimoku Article

As you can see, the Ichimoku Kinko Hyo strategy is reliable for trading profitably. However, the trader requires to master reading the indicator with five key lines concurrently and analyze the clouds the indicator shows.
Here is a recap of the main parts of the Ichimoku indicator:
- First is the Kumo or best referred to as the cloud
- Kijun, or refer to it as the Baseline
- Tenkan, or the Turn line (Conversion line)
- Chiko, or the Delay
- Senkou Spans as the midpoints of price ranges
Ichimoku can be challenging for new traders but also comes in with a slightly higher requirement to analyze before jumping into trades. And this is a combination that can thoroughly enforce the required discipline in the trading careers.
As a trader grasps the analysis of the all-in-one indicator, they’ll appreciate the many angles it presents. Ichimoku goes above to give future predictions for support and resistance zones. Also, it’s an indicator that will show the signs of a reversal from a current trend. In that perspective, Ichimoku allows traders to reap confidently from the current trend as well as give prior insight into future levels of the market prices.
As an indicator, Ichimoku has its portion of flaws. One is the mixed signals it shows for choppy markets. Secondly, Ichimoku fails at showing the volumes of trade, but these are flaws you can fix smartly by working with another indicator that shows the volume of trade. The MACD can very well help with that.
Lastly, the best way to approach Ichimoku trading would be to master its analysis and look for trend following signals or opportunities. Reversal traders can also comfortably sit and wait for signs of a trend reversal. It’s also best to check things with another indicator concurrently. That way, your trading is built on reasonably in-depth analysis and confirmations.
Ways to Read Forex charts FAQs
How accurate is Ichimoku?
Ichimoku is an accurate indicator if traders use it in the right conditions in the markets. To set the information very clearly here, Ichimoku will work on trending markets. This will help a trader ride a current up or downtrend and exit when reversal signals are shown by the indicator.
The other way to go about with Ichimoku is to be a perfect reversal trader. That means your discipline is not to jump into a current trend but follow it until Ichimoku shows adequate reversal signs. Only then can you jump in.
Since trading is a discipline that requires more than a single indicator, Ichimoku will fail you flat at some metrics. First on that list are the volumes traded. Given the fact that Ichimoku will not help, it’s best to ride on another indicator to show the volumes to help you make better predictions.
The accuracy of Ichimoku is adequate enough to help you grow a forex account positively. However, it’s an indicator whose accuracy is a huge doubt with choppy markets. In choppy markets, the signals sent by the indicator will be far more confusing than helpful.
Is Ichimoku a good strategy?
Yes, Ichimoku is a good strategy. But as far as it comes out as an indicator, traders have to deploy it correctly – incorrect situations in the market for it to be helpful. For new traders, the five lines and the clouds present a steeper learning curve.
A good strategy with Ichimoku will prove amazingly helpful if it’s built on two facts: One is deploying the strategy in trending markets and shelving it for choppy markets. Secondly is analyzing markets with other indicators to see if volume fill-up the minimums you require to open a trade.
Towards building into the helpfulness of Ichimoku, other significant facts need to be in place. By a good strategy, we refer to one that will allow you to ride the markets with minimal risks and maximize on expected rewards. Of course, also market timing plays a role in the success rates of a strategy.
Lastly, a trader has to approach markets with clear signaling from Ichimoku. So there must be the discipline to analyze the lines and the cloud formations to inform the decisions. With everything else done correctly, the Ichimoku cloud strategy can help traders grow accounts if they use it correctly.
Which time frame is best for Ichimoku?
Ichimoku can best apply to any time frame, either short or long. The best trading strategy with Ichimoku will not chase the obsession with timeframes. Rather, the strategy should take on the insights of the indicator and help them pull out the best trades for any timeframe a trader picks to trade.
Having said the above, Ichimoku is a good strategy if a trader is able to combine it with an in-depth analysis of markets. Also, it’s wise to bring in two or three more indicators into the analysis helping to sift through metrics.
Therefore, if Ichimoku works best with your strategy within the 4-hour timeframes, it makes no sense to make attempts to force-trade with it within either shorter or longer timeframes. And that brings us to the limitless opportunities when a trader is able to approach markets openly without the confines of trading within set time frames.
Lastly, try combining Ichimoku with trading strategies that win in trading with a shift away from confining oneself to trading within time frames.
Wilbert S
Wilbert is an avid researcher and is deeply passionate about finance and health. When he's not working, he writes research and review articles by doing a thorough analysis on the products based on personal experience, user reviews and feedbacks from forums, quora, reddit, trustpilot amongst others.


