Silver Price Analysis: Weekly Breakout Amidst Neutral Stance
By Daniel M.
April 2, 2024 • Fact checked by Dumb Little Man

Market Outlook
Silver’s latest rally, which culminated in a bullish breakout above last week’s high, points to additional increases. However, caution is advised as resistance and support levels come into play within the current bullish trend.
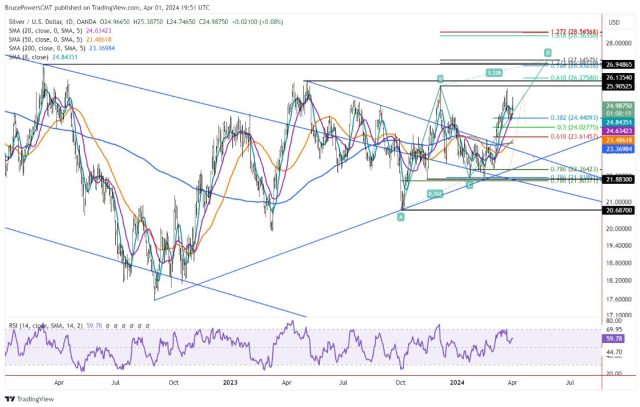
The recent increase in silver prices, followed by a return to support near the 38.2% Fibonacci retracement and the 20-day moving average, highlights the market’s volatility.

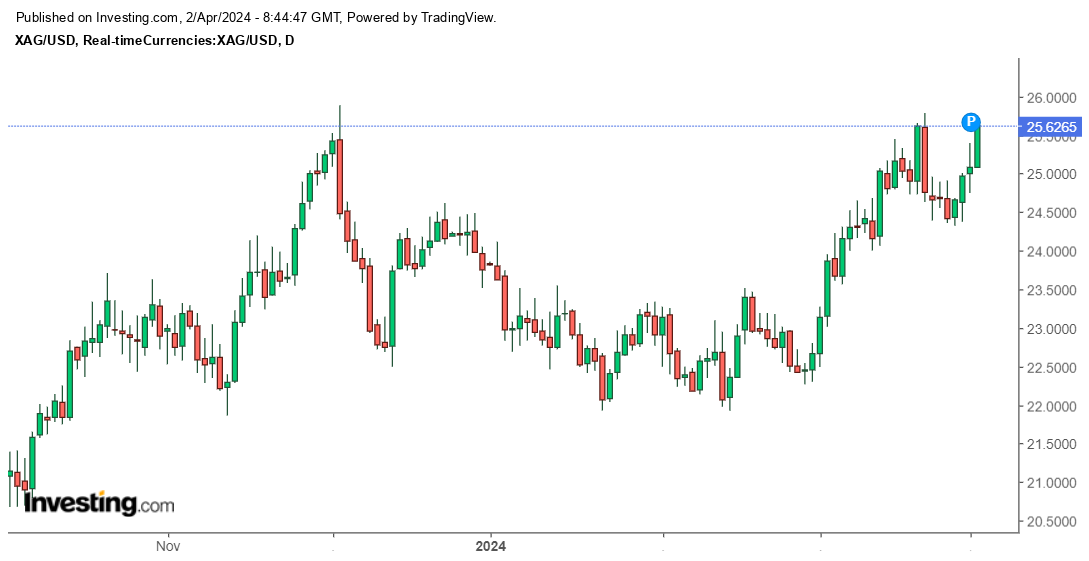
Despite Monday’s surge initiating a bullish weekly breakout, resistance was met around $25.39 before a retracement. The price activity indicates a neutral stance, with silver expected to finish somewhat weak for the day.
Key Price Levels and Targets
Silver’s 15.7% rally over the last 16 days suggests fresh market interest, albeit with resistance near the $25.78 peak.
Surpassing the major resistance level at $26.14 would affirm the developing uptrend and pave the door for higher goals beginning at $26.95. An ascending ABCD pattern points to a longer-term target of $27.15, indicating potential further gains.
Caution Amidst Bullish Sentiment
Despite the bullish outlook, silver should be approached with caution until it crosses the swing high of $25.78.
Lower Fibonacci retracement levels and crucial moving averages could support a retracement. Monitoring price activity below the $24.33 swing low will provide information about the market’s trajectory.
US Economic Resilience and Impact on Silver
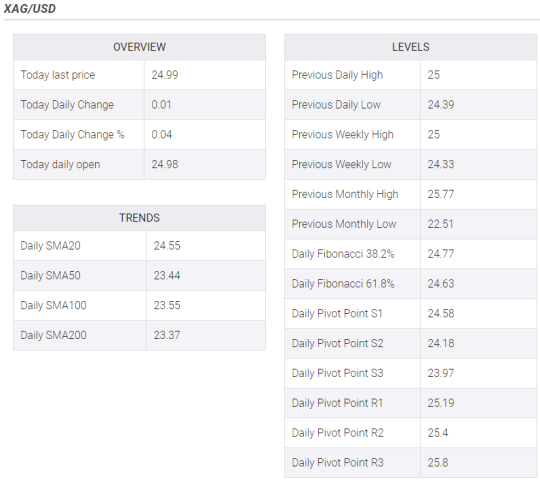
The XAG/USD pair’s neutral trading near $24.98 highlights market concern following strong US economic data.

Positive signs from the Institute for Supply Management (ISM) report and the Manufacturing Purchasing Managers’ Index (PMI) point to economic strength, which reduces the possibility of the Federal Reserve easing.
This sentiment has fueled hawkish bets and caused an increase in US Treasury yields, impacting silver prices.
Anticipated Labor Market Data
Upcoming US labor market statistics, such as Nonfarm Payrolls and Average Hourly Earnings, are extensively monitored for clues about economic health and policy direction.
These data pieces will influence market expectations and investor sentiment in the following days.
Technical Analysis
On the daily chart, the XAG/USD’s Relative Strength Index (RSI) shows buyer dominance, indicating that upward momentum will continue.

However, the Moving Average Convergence Divergence (MACD) indicates some modest bearish pressure. The pair maintains above major Simple Moving Averages (SMA), indicating strong rising momentum over longer periods.
Daniel M.
Daniel Moore is a seasoned trading analyst with over 20 years of experience navigating the ever-evolving financial landscape. Renowned for his unconventional yet effective approach, Daniel utilizes a blend of technical and fundamental analysis to identify hidden gems and craft winning trade strategies. He is a master at demystifying complex market data and translating it into actionable insights for traders of all experience levels.

