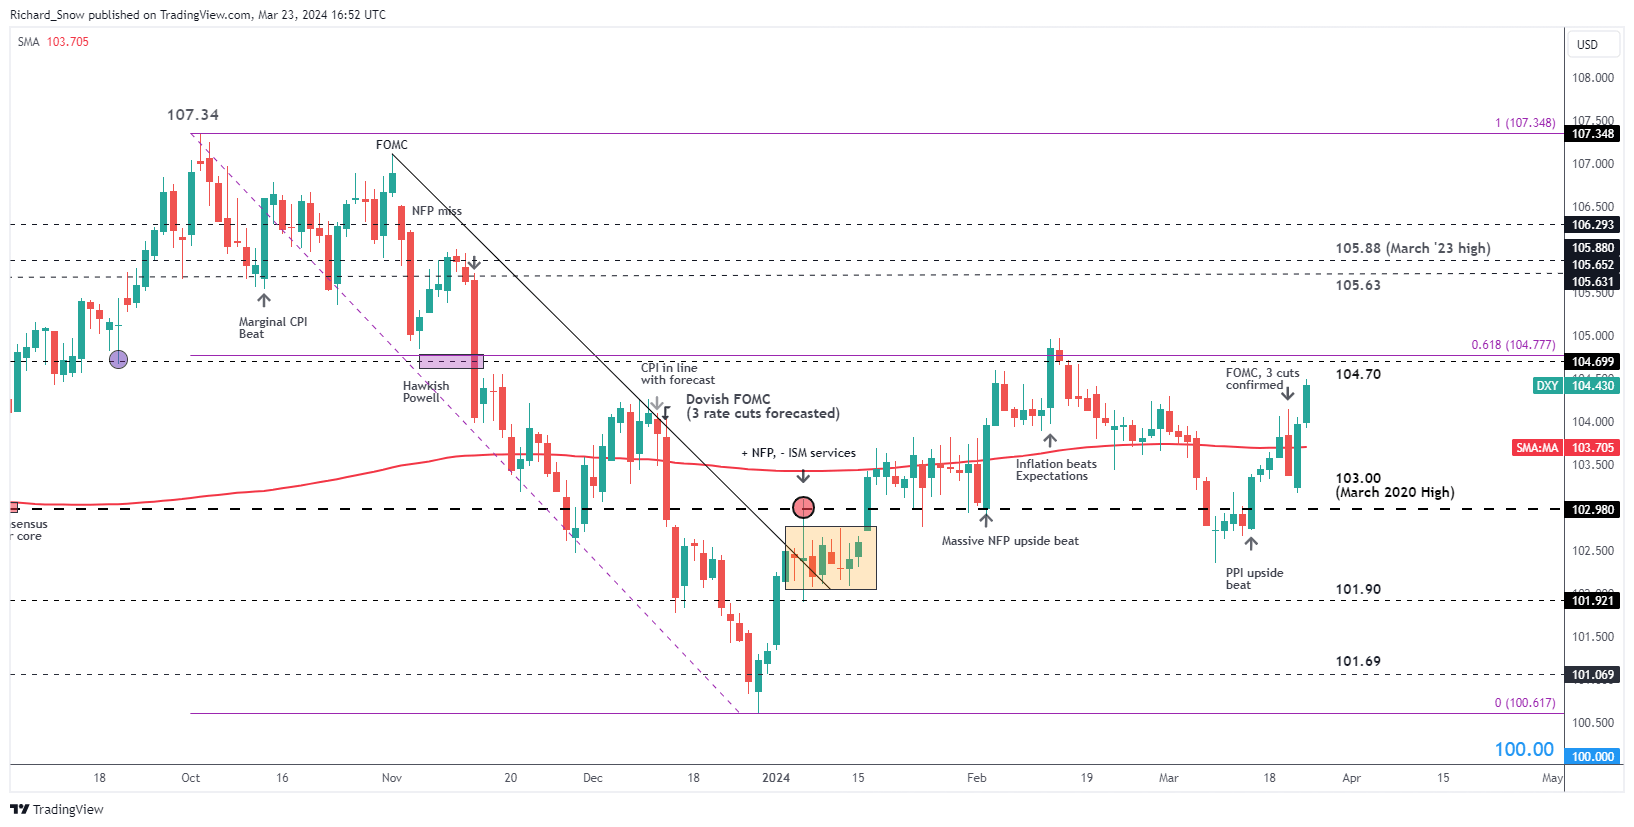
US Dollar Index (DXY) Overview
The US Dollar Index (DXY), a key indicator of the US dollar’s performance, has demonstrated a strong start to the year. This rise in strength is attributed to solid economic data that led to a revision of previously anticipated aggressive rate cuts. Even with the Federal Reserve conveying a more cautious tone and sticking to its forecast of three rate cuts in 2024, the index experienced a surge in March.
Currently, the index is trading above its 200-day simple moving average, reaching towards 104.70, and is also navigating near the 61.8% Fibonacci retracement level of its late 2023 downturn.
EUR/USD Analysis
In Q1, EUR/USD saw a decline, further highlighting the diverging economic trajectories between the EU and the US. The US dollar’s advantageous interest rate differential has made it more appealing, especially in times of low market volatility, as investors favor investing in currencies with higher yields. Although this trend is more pronounced in the USD/JPY pair, it similarly affects the Euro’s attractiveness.
The pair faced resistance at 1.1033 and 1.1140, eventually dropping to find support at 1.0724. Despite a brief rally attempt by the Euro, it failed to challenge the yearly highs, trending lower as the quarter concluded.
For Q2, the 1.0724 mark is crucial for EUR/USD as it could trigger further declines. The depicted red and blue squares illustrate a potential trading range, considering the past quarter’s average movements. With a downward bias for the Euro and a bullish outlook for the dollar, the initial target is set at 1.0656, with 1.0450 marking a significant downturn level.
The uncertain central bank rate cut timeline suggests that forex movements might be nonlinear. Therefore, potential upward targets are identified at 1.0929 and 1.1033, with movements beyond 1.1100 towards 1.1140 potentially altering the bearish view for the quarter.
GBP/USD Insights
GBP/USD stands out for its resilience against the US dollar, with minimal losses in Q1, despite market fluctuations. The Bank of England’s cautious approach to interest rate reductions, amidst high inflation, has lent support to the Sterling. However, with inflation expectations to normalize mid-year, the currency’s outlook may align more closely with broader market trends.
The currency pair has maintained its strength against the robust dollar, with the BoE’s rate mirroring the lower spectrum of the Fed’s range. The depicted chart outlines potential movement directions based on recent trends.
On the downside, the initial challenge is at the 1.2520 mark, with further declines potentially leading to 1.2250. Ahead of this, the 1.2295 level represents a significant midpoint of past movements.
Conversely, a rise above the 61.8% Fibonacci retracement at 1.2756 and then 1.2960 could challenge the bearish GBP/USD outlook.
USD/JPY Review
USD/JPY captured attention in Q1, primarily due to the Bank of Japan’s pivotal shift away from negative interest rates in response to inflation and wage growth. This decision, however, did not favor the yen, contributing to its continued devaluation.
With challenges both domestically and internationally, further rate hikes by the Bank are constrained, making a reversal in the carry trade trend less probable.
The USD/JPY pair is especially volatile around the 150.00 mark, where governmental disapproval could temper bullish momentum. Hence, trading above this level is deemed highly speculative. Based on past quarter trends, while a climb to 160.00 is theoretically possible, each increment above 150.00 becomes increasingly uncertain.
In Q2, without intervention from Japan, the USD/JPY is likely to oscillate between 146.56 and 152.00. Speculation about additional Bank of Japan rate hikes later in the year remains speculative and beyond the scope of this analysis.
